Map Catalog 2013
Friday, November 15, 2013
Range Graded Proportional Circle Map
This is a range graded proportional circle map. The ranged graded map overlaps more than one variable. By looking at the map above, you can distinguish where the Hispanic population is in the United States. In addition, you can also distinguish how the Hispanic population compares to the rest of the population of the state.
This map is located at:
https://www.e-education.psu.edu/natureofgeoinfo/book/export/html/1553
Bivariate Choropleth Map
The Bivariate Choropleth map charts 2 variables of information. This one is charting the population under the age of 18 and rural population of Warsaw. Using more than one variable can help give a better understanding and see if the variables are related.
This map is located at:
http://www.geo.unizh.ch/~annal/Choropleth%20maps.html
Standardized Choropleth Map
This is a standardized Choropleth map of the population of Canada in 2006 who is under the age of 15. The map shows the percentages of the population in the area. The darker the shade indicates a larger percentage of people under the age of 15.
This map is found at:
http://www.statcan.gc.ca/pub/92f0138m/2008003/figures/5200001-eng.htm
Nominal Area Choropleth Map
This is a nominal area choropleth map demonstrating the health care costs in the United States in 2006. The lighter shaded areas are less expensive and the darker shaded areas are more expensive. One aspect of the map is that some of the darker shaded areas are popular retirement areas and would have an older population as a whole. I would be interested to see this map side-by-side with an economic one, to see if the areas that spend more money on health care line up with the less fortunate economic areas.
This map is located at:
http://chandoo.org/wp/2009/07/24/medicare-chart-critique/
Thursday, November 14, 2013
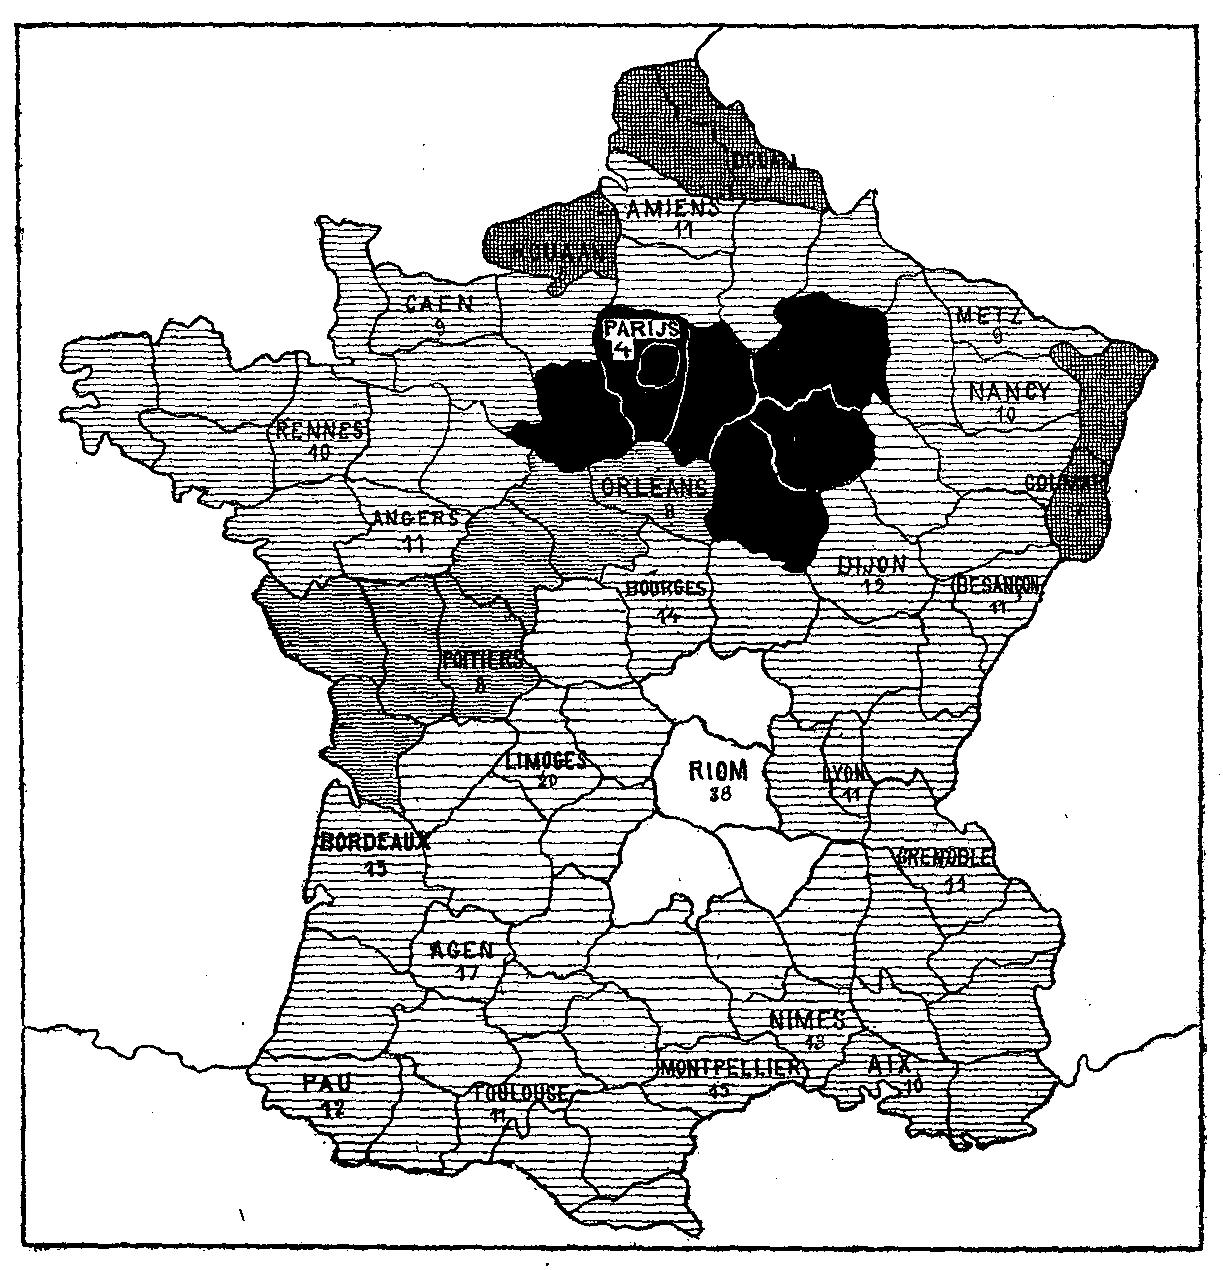
Unclassed Choropleth Map
This is an unclassed choropleth map of France in 1826. This type of map was developed by Charles Dupin.
This map is found at:http://euclid.psych.yorku.ca/SCS/Gallery/milestone/sec5.html
http://euclid.psych.yorku.ca/SCS/Gallery/images/dupin2.gif
Classed Choropleth Map
This is a classed choropleth map. This map shows how much money is spent per student in the state of North Carolina by county.
This map is found at:
http://personal.uncc.edu/lagaro/cwg/color/Choropleth-5Good.gif
Continuously Variable Proportional Circle Map
This is a continuously variable proportional circle map. The map shows motor vehicle deaths in California.
The map on the left depicts the numbers with circles, the one on the right depicts the the numbers using different sized cars.
This map is found at:
https://www.e-education.psu.edu/geog486/book/export/html/1796
Subscribe to:
Posts (Atom)