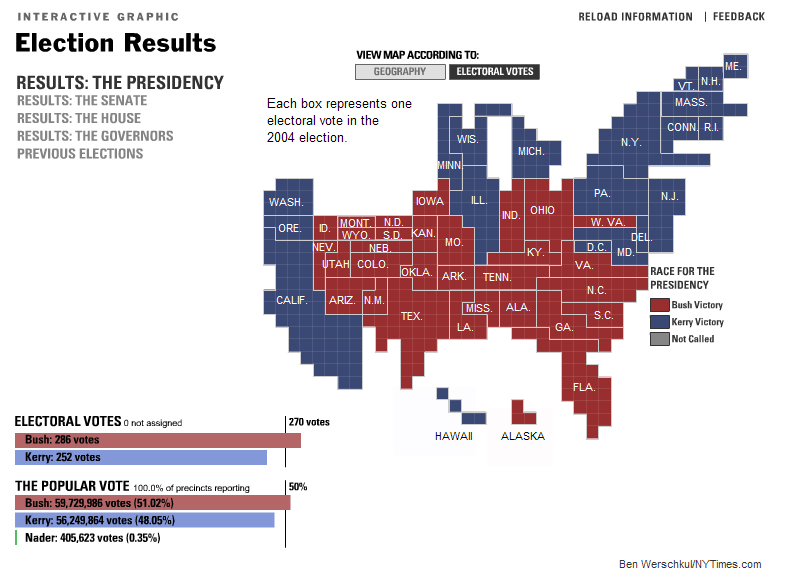
This cartogram documents the electoral vote breakdown from the Presidential election of 2004. The state is the size of how many electoral votes it receives in a presidential election. Cartograms can be used to show statistics for all types of locational demographics, whether it be horticulture, animal life, or politics.
This map is found at: http://vis.berkeley.edu/courses/cs294-10-fa07/wiki/images/a/ae/NYTCartogram2000.jpg
No comments:
Post a Comment