Friday, November 15, 2013
Range Graded Proportional Circle Map
This is a range graded proportional circle map. The ranged graded map overlaps more than one variable. By looking at the map above, you can distinguish where the Hispanic population is in the United States. In addition, you can also distinguish how the Hispanic population compares to the rest of the population of the state.
This map is located at:
https://www.e-education.psu.edu/natureofgeoinfo/book/export/html/1553
Bivariate Choropleth Map
The Bivariate Choropleth map charts 2 variables of information. This one is charting the population under the age of 18 and rural population of Warsaw. Using more than one variable can help give a better understanding and see if the variables are related.
This map is located at:
http://www.geo.unizh.ch/~annal/Choropleth%20maps.html
Standardized Choropleth Map
This is a standardized Choropleth map of the population of Canada in 2006 who is under the age of 15. The map shows the percentages of the population in the area. The darker the shade indicates a larger percentage of people under the age of 15.
This map is found at:
http://www.statcan.gc.ca/pub/92f0138m/2008003/figures/5200001-eng.htm
Nominal Area Choropleth Map
This is a nominal area choropleth map demonstrating the health care costs in the United States in 2006. The lighter shaded areas are less expensive and the darker shaded areas are more expensive. One aspect of the map is that some of the darker shaded areas are popular retirement areas and would have an older population as a whole. I would be interested to see this map side-by-side with an economic one, to see if the areas that spend more money on health care line up with the less fortunate economic areas.
This map is located at:
http://chandoo.org/wp/2009/07/24/medicare-chart-critique/
Thursday, November 14, 2013
Unclassed Choropleth Map
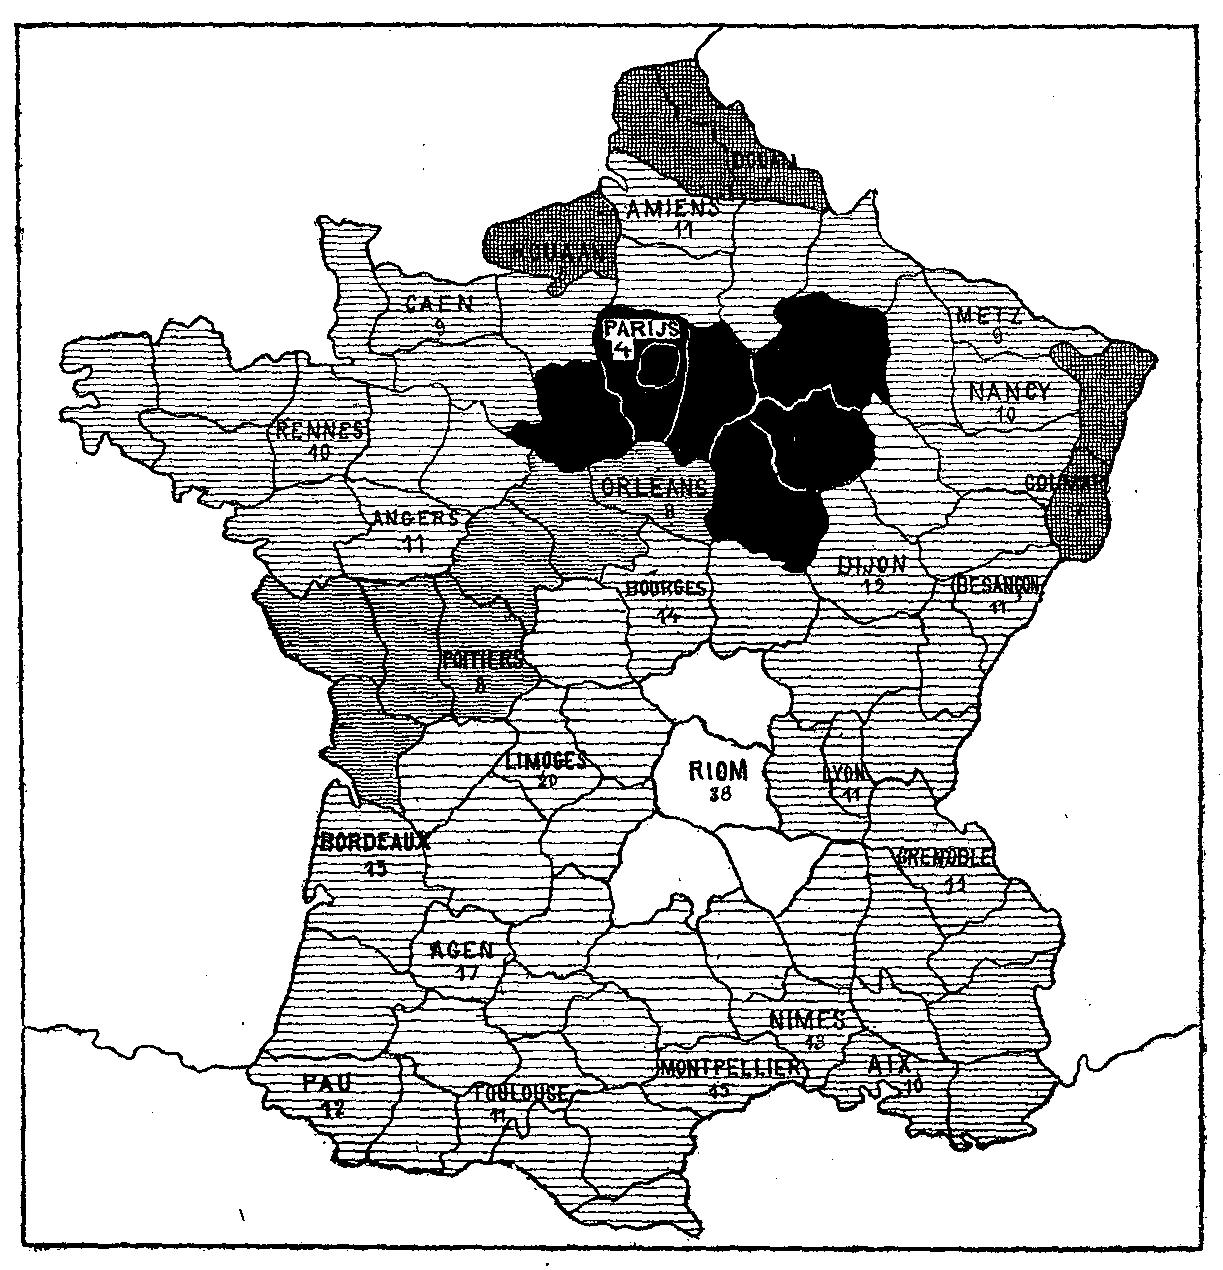
This is an unclassed choropleth map of France in 1826. This type of map was developed by Charles Dupin.
This map is found at:http://euclid.psych.yorku.ca/SCS/Gallery/milestone/sec5.html
http://euclid.psych.yorku.ca/SCS/Gallery/images/dupin2.gif
Classed Choropleth Map
This is a classed choropleth map. This map shows how much money is spent per student in the state of North Carolina by county.
This map is found at:
http://personal.uncc.edu/lagaro/cwg/color/Choropleth-5Good.gif
Continuously Variable Proportional Circle Map
This is a continuously variable proportional circle map. The map shows motor vehicle deaths in California.
The map on the left depicts the numbers with circles, the one on the right depicts the the numbers using different sized cars.
This map is found at:
https://www.e-education.psu.edu/geog486/book/export/html/1796
DLG map
This is a DLG of the Southwestern quadrant of the United States. DLG stands for digital line graph.
This map is in digital vector form.
This map is found at:
http://geochange.er.usgs.gov/sw/resources/sw_basemap/
Isoline Map
The isoline maps show continuous lines of temperature. This is a map of MaunguWhau Volcano (or Mount Eden) found in New Zealand.
You'll see how the temperature gets warmer around the middle of the volcano.
This map is found at:
http://www.improving-visualisation.org/vis/id=242
Hypsometric Map
This map is found at:
http://www.aridocean.com/SKU-R53PQA4-Australia-shaded-relief-map
Wednesday, November 13, 2013
Cartographic Animation
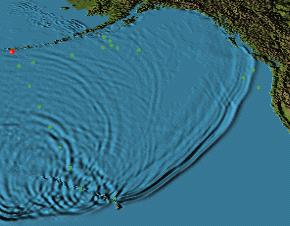
This is still shot of a Cartographic Animation of a Tsunami. Cartographic Animations can demonstrate activity natural occurrences. These maps help give the public an explanation for such disasters.
This is map is found at:
http://nctr.pmel.noaa.gov/Titov/show/
DEM
Before After
This is a DEM or Digital Elevation Model of Mount St Helens before and after her eruption on May 18, 1980. The digital elevation model give a better visualization of the land elevations. Information can be gathered from land surveys, Lidar, or Radar.
The photo above shows that the eruption had a clear effect on the surface of the Mountain.
This map is found at:
http://ned.usgs.gov/Ned/historic.asp
Parallel Coordinate graph
This is a Parallel coordinate graph of the Drosophila Gene Expression. This is a 3-D version of the graph. This graph shows how close the genes are in the fruit fly. Maps like these can show numbers that are really similar.
This map is found at:
http://vis.lbl.gov/Vignettes/Drosophila/
Proportional Circle Map
This is a Proportional Circle Map on the Hispanic Population of the United States and territories. These maps have circles on them to display the amount of of statistics. The bigger the circle is on the map the larger the number of Hispanic people there are in the state.
This map is found at :
https://www.e-education.psu.edu/natureofgeoinfo/c3_p16.html
Tuesday, November 12, 2013
Flow Map
Flow maps can be used to map out sequential thinking. This map is a step-by-step instruction on how to make a peanut butter sandwich.
Flow maps are a good visual for those who are more visual thinkers.
This map is found at:
http://www.nhcs.k12.nc.us/parsley/Curriculum/ThinkingMaps.html
Choropleth Map
Choropleth maps use different hues of a color to demonstrate the numbers of statistics in the areas on the map. The choropleth maps can show a wide variety from health to economic to divorce statistics. The map above shows the results from the 1990 census on where American Indians, Eskimos, and Aleut Persons are located in the United States of America. The darker the hue the larger the numbers are in that area.
This map is found at:
https://www.census.gov/geo/maps-data/maps/race-hisp1990.html
Dot Distribution Map
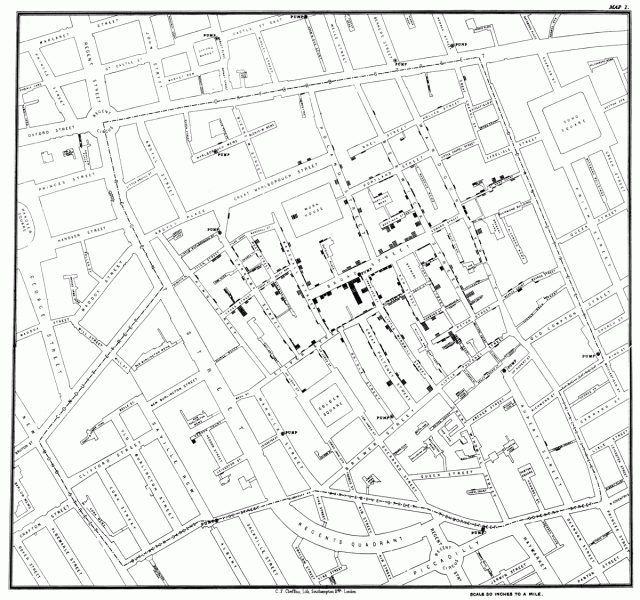
Dot distribution maps are most commonly used to show population in the area. The map above is the famous map made by Dr John Snow in 1854, during the cholera epidemic in London.
His research through mapping helped pinpoint the cause of the epidemic to a water pump located on Broad Street.
This map is located at:
http://scienceline.org/2010/05/john-snows-maps-of-the-broad-street-cholera-outbreak/
Planimetric Map
A planimetric map is a two-dimensional map. This is a map of the Best and Shortest Cattle Route in Texas. The map shows the railways from Corpus Christi, Texas to Red River station in Kansas. This is a great look into the past of our country as cattle brought an economic boom into much of the west and most notably, Texas.
This map is found at:
http://www.loc.gov/rr/geogmap/guide/gmillgen.html
PLSS Map
This is a Public Land Survey System Map. The system was developed through the Land Ordinance of 1785 after the American Revolution to help retrieve losses from the the war. The PLSS evolved again during the Northwest Ordinance of 1787. This rectangle survey was created to show and assist in the transfer of ownership of land. The PLSS was developed after the original 13 colonies, which are set up on a metes and bound system.
This map is found at:
http://nationalatlas.gov/articles/boundaries/a_plss.html#two
Subscribe to:
Posts (Atom)